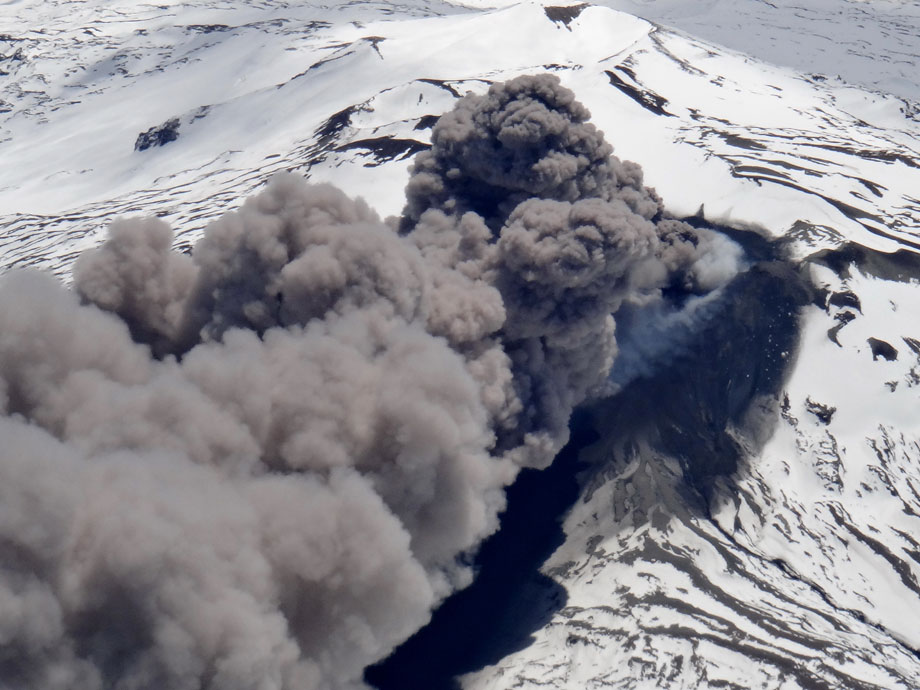
Eruption of the volcano Copahué December 22nd décembre
Undulations of the plume of ashes: every particle moves only of few hundreds meters.
The characteristics of these new situations are:
- A relatively greater warming of the upper air mass. . As last year, we have taken note of the temperatures at 6.000 m (and often beyond) as much as possible, the data are reported on the fig.1 showing the results of our measurements together with the official QNH at takeoff.
| Temperature growth at 6.000 m and local QNH local function of the date |
The measurements made at altitudes higher than 6000 m have been reported back to 6000 m according to the law of the standard atmosphere (y=15-0,0065x). The red dotted line shows the temperature data and the red continuous one is the tendency curve. In the same way the blue curves refer to the QNH, right scale. Similarly to the past year, the average temperature at 6000 m evolved from -15°C at the beginning of the season to -11°C at the beginning of January, with however important variations from one day to another, the coldest day being December 25th with -21°C (SW sector wind) and the hottest one being December 30th with -7°C (wind initially SW turning W-NW).
The warming of the higher layers is therefore in the range of 8 to 12°C with respect to the standard, between the beginning and the end of the austral spring, which is so enormous that it can explain the weak energies (in terms of climb rates Vz) that we found this season. But there is worse, because higher the altitude higher the overheating, for example the measurement of -24,5°C measured at 8.500 m the 30/12 against -40,2°C standard, means 15,7°C overheating. Just crazy. The meteogramme of these days is reported in fig.3. Under these conditions, it is no surprise that the wave of the mythical Domuyo volcano dropped down from 15 m/s met in 2002 to 3-5 m/s of these last years, for similar or even higher wind speeds.
|
Meteogramme of Bariloche, December 25th to 29th. |
Looking at the red curve, one can observe the gradual increase of the average temperature versus the advancement of the season, a phenomenon that was not obvious the previous year.
Fig. 2 shows the trend of this same temperature at 6.000 m versus the QNH. The tendency curve is very coherent but the result is surprising to our European eyes, since high pressure in spring and in summer means high temperature, but in Patagonia it is precisely the opposite. Simply because the steady high pressures were centered west of our position and considering the anticlockwise rotation of the anticyclonic katabatic winds, the air flows directly from the south pole, above a frozen sea without possibility to warm-up on the ground, at best on some glaciers flowing directly into the ocean. However I have to admit that we made measurements only on flying days, therefore days of wind, and that the situation might be different when we were becalmed at the beach.
| Temperature at 6.000m vs. QNH |
2. The persistence of a blocking high pressure centre on the Atlantic at our latitude that shifts the trajectory of the fronts northbound or southbound, creating divergences and rotations whose effect is negative for the stability of the wave systems. A typical TEMSI map is shown in fig. 4.
| TEMSI of a typical situation with a blocking high pressure |
3. The periodic appearance of a high pressure cell on the Pacific ocean whose centre is located right at our latitude, or even higher latitudes, i.e. more south,, generating some cold and dry low speed katabatic south flows. The fig.5 shows the situation of December 25th generating a weak south flow (10 to 20kt) but sufficient to produce single waves downwind of every mountain and finally permitting us to make nice sightseeing flights deep into the Cordillera, an area totally obscured by cloud on big wave days.
| Typical south flow situation, MSL pressure and geopotential |
The Fig.6 shows the distribution of the winds at 5.000 m for this same Christmas day, that fits well with the weak katabatic flow, 20kt due south for more than 1.000 km southbound, permitting however very nice flights.

Winds at 5.000m on December 25th, weak katabatic south flow