Contrary to the usual latitudes in the northern hemisphere (45 °± 5), the observation of the pressure and geopotential fields and frontal systems at our latitude (22 °S) gave us practically no useful information.
- In one month, we haven’t seen any front passing. The air mass was (almost) different every day, but the sky was always the same blue, except for a few very high cirrus clouds, a weak but important signal to understand that something will change.
- In one month, the wind on the ground in Calama was every day exactly the same, according to the wind rose in par. 10.
- In one month, the color of the geopotential field at 500 hPa (isohypses) (below) supplied by Topkarten (GFS) did not vary by a single gradation of brown, on more than half of the American continent, including Brazil, the northern half of Chile, Bolivia and Peru. No ridge nor trough to predict a change in the air mass or any significant flow as we understand it in the Northern hemisphere. This map has only a relative significance since the ground of the Bolivian Altiplano is itself around 500 hPa.
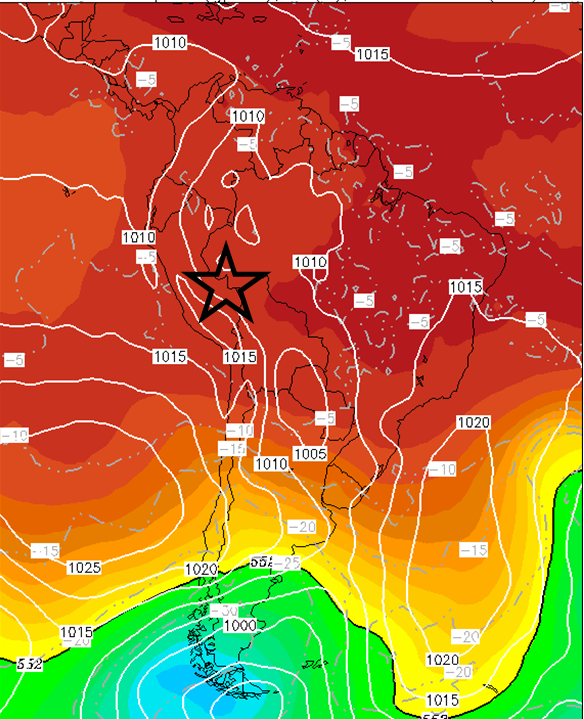
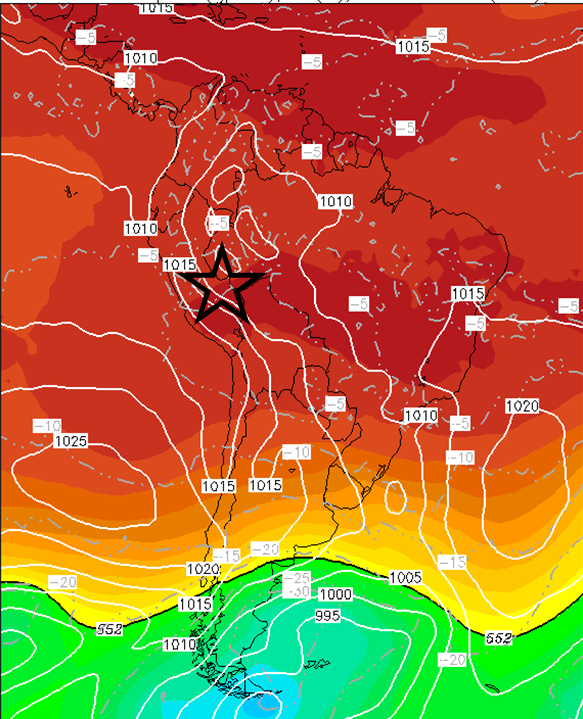
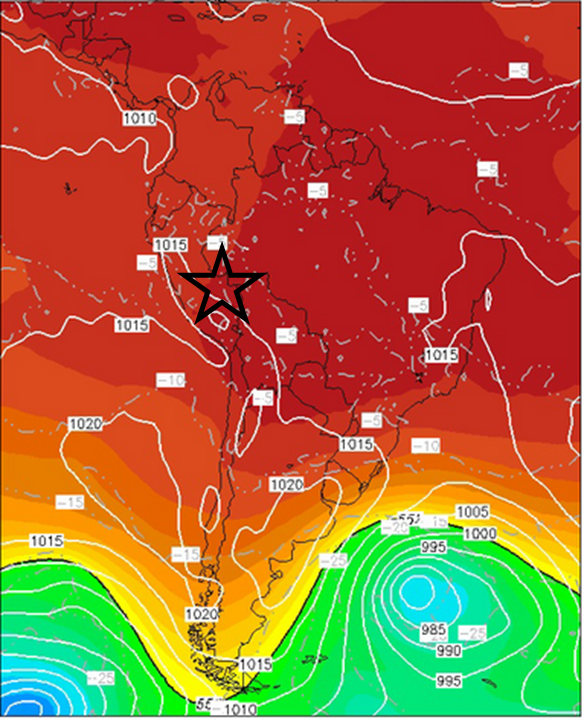
500 hPa geopotential maps of the South American continent published by Wetterzentrale/Topkarten (GFS model). Who could predict three extraordinary days of waves and hydraulic jumps for these days of 26 and 27/11, and December 1st? The isobars (white lines) have no meaning since they are below the ground level, the geopotential fields (colors) are actually at the level of the Altiplano, of little use. The color code is shown above, the star shows our flight area.
-
The public meteorological web sites that we were using during our previous Argentinean Patagonia expeditions were very useful for the forecast of winds at higher levels. Combined together with SkySight, we were finally able to start planning the right days, but it was near the end of the expedition. We must return!
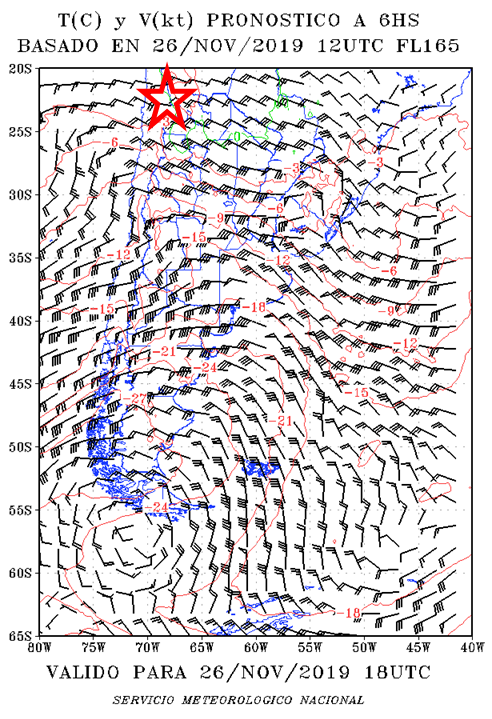
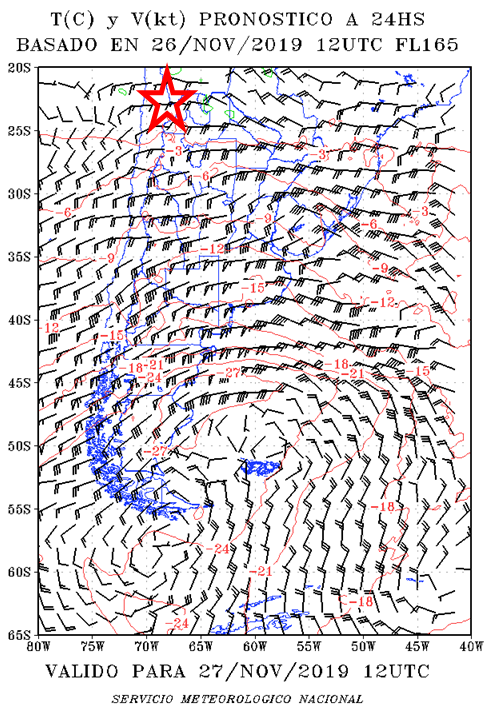
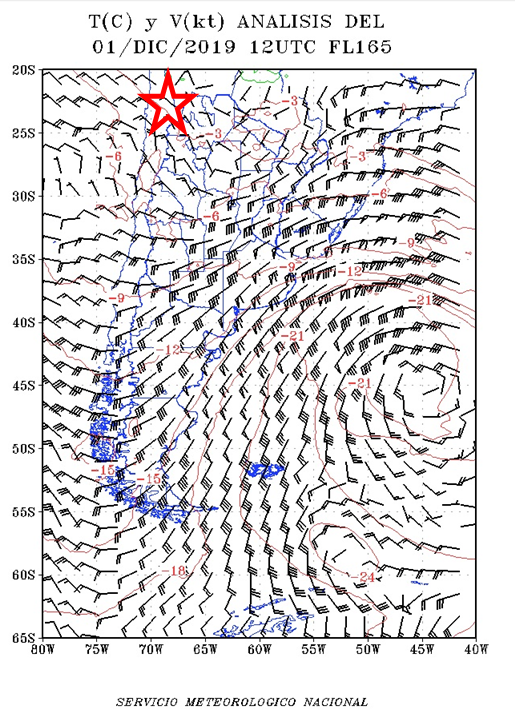
The wind forecast at FL165, that is to say at 500 m AGL for these same 3 days. Our latitude is 22°S, the red star shows our flying area. Apparently, nothing interesting according to our usual criteria, with only 10 to 15 kt at this altitude. However, there is a strong acceleration 500 km to the south, which then extends to the 52°S, over 3,000 km in length. The system is always driven by the vortex located at the southern end, towards Ushuaia, with presence of a jet stream located between Santiago and the southern margin of our position. Conclusion: the same causes produce the same effects even at the tropics, but in much more quiet and comfortable conditions, without clouds or rain. We started to learn to interpret these “weak signals”.
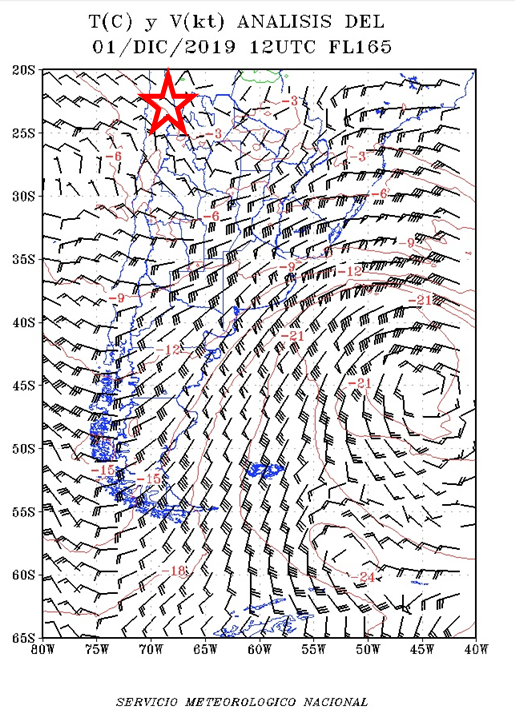
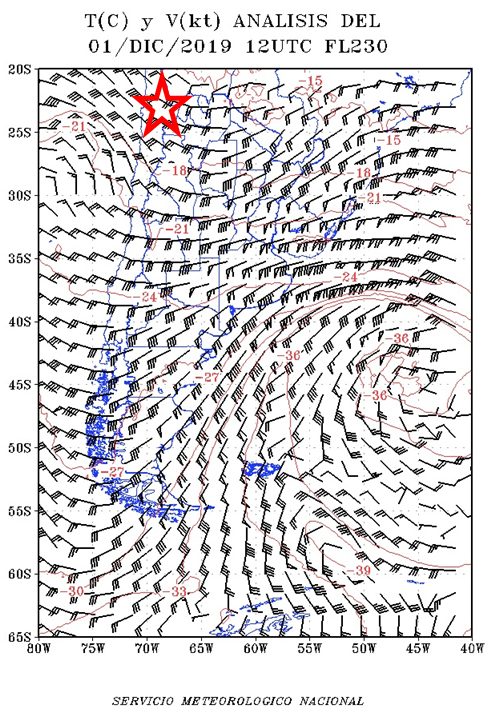
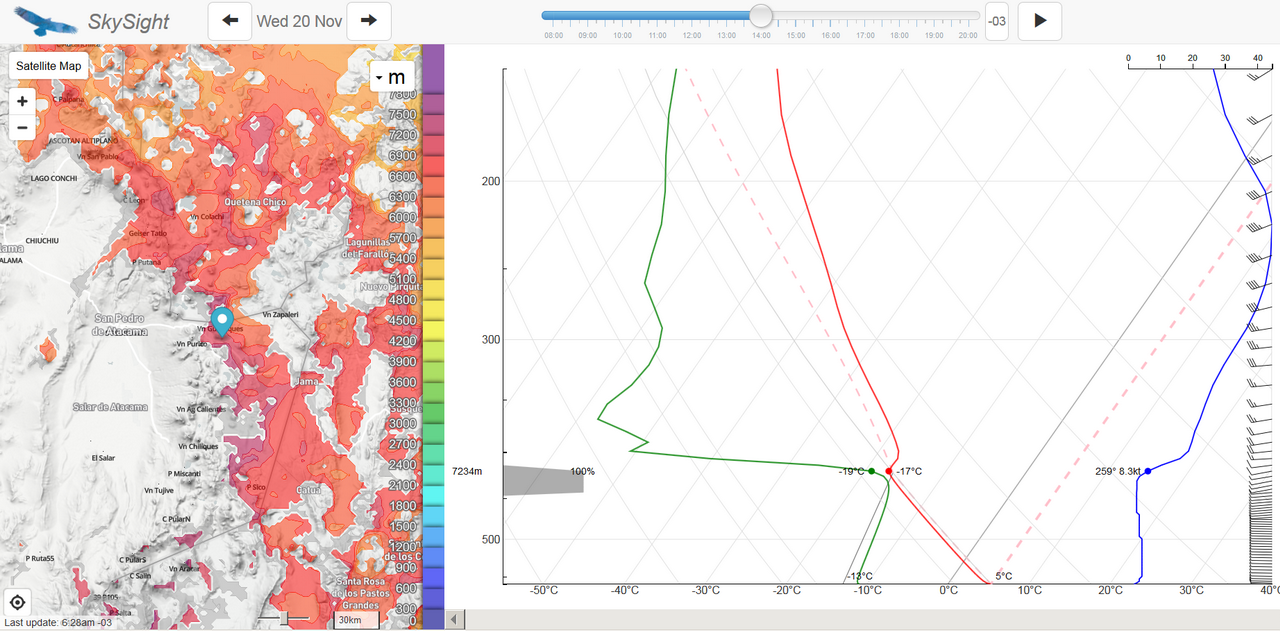
The analysis of the winds at FL165 and FL230 is one of the keys to understanding the phenomenon of December 1st. The wind gradient is strong, starting from only 10-15 kt at 500 m AGL altiplano, to 35-40 kt at 7,000 m, or 1,000 m above the peaks. There was no wind on the ground in San Pedro (2,400 m), not enough to make the ridge work at volcano Sairecabur at 5,000 m, but just enough to generate a weak downwind convergence, which ended in a delirium above 6,000 m.
Too bad it took almost 20 days for Matthew (Mr. SkySight) to change the altitude scale, which was the usual one in use in the so-called “developed” countries, therefore maximum 6,000 m (FL195), totally useless for us. With 8,000 m for thermal and 7,000 m for wave, we started to understand the systems 10 days before packing up.
The two main strong points of this software are 1) the possibility to generate a Skew-T diagram with wind profile at any point on the planet and 2) to generate wave forecasts at all levels in steps of 1.000 m up to 7,000 m, all every 30 min from dawn to sunset. With of course the ability to carry these forecasts in dynamic flight mode (i.e. with the position of the glider on the screen) on your tablet, smartphone, Naviter LX 9000 or Oudie, without the need for an Internet connection, obviously nonexistent in the desert.
For an unknown reason, the absolute values of the temperatures indicated in the diagrams are 10 to 13 °C lower than reality, both measured by the LX9000, the OAT display and by our feeling, since even at 7,000 m we were comfortably flying in short-sleeved shirt, as for Jean-Pierre, who flew barefoot in his Croc’s clogs.
The example below shows the formation of the “Bolivian winter” at around 2 p.m. local time, that is to say the welding of all the cumulus clouds up to 100% cloud cover, which then collapse in coils, the rain very rarely reaching the ground and in any case only in the area of volcanoes and never in the Atacama desert.
Looking at the jet stream maps, we observed that any presence of a trough or a ridge, or a jet stream, up to 1,000 km south, had a significant influence on local thermodynamic conditions. Why wave systems in the tropics are so sensitive to the slightest altitude flows, even very weak, this will be the subject of a more in-depth study which will be presented at the next OSTIV congress in 2021. The first days, we did not did not know how to interpret these “weak signals”, but things improved together with SkySight who worked in parallel, even if it remained often a little optimistic. The two examples below illustrate an easy and realistic forecast, except that we did not know how the phenomenon would materialize. It happened in fact much more intense than we had imagined.
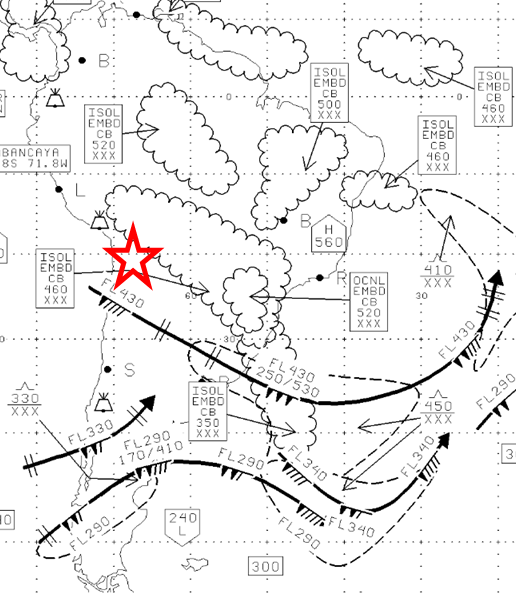
The SIGWX map for America (Significant Weather) clearly shows a 90 kt jet stream at FL430 (13,000 m) approx. 600 km south of our flying area, and a whole area of Cb on the Andean Bolivian-Argentinean range, which will be materialized by a gigantic hydraulic jump, a stationary front which will remain steady all the afternoon.
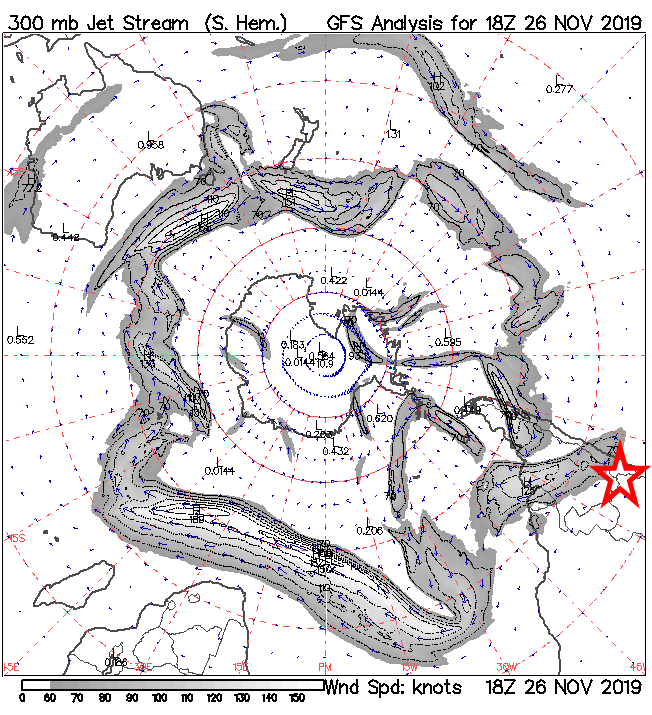
The circumpolar jet stream map at 300 hPa confirms the SIGWX map by adding the width of the flow, which extends over nearly 1,000 km, speed 60-100 kt. The result was unexpected and extraordinary.
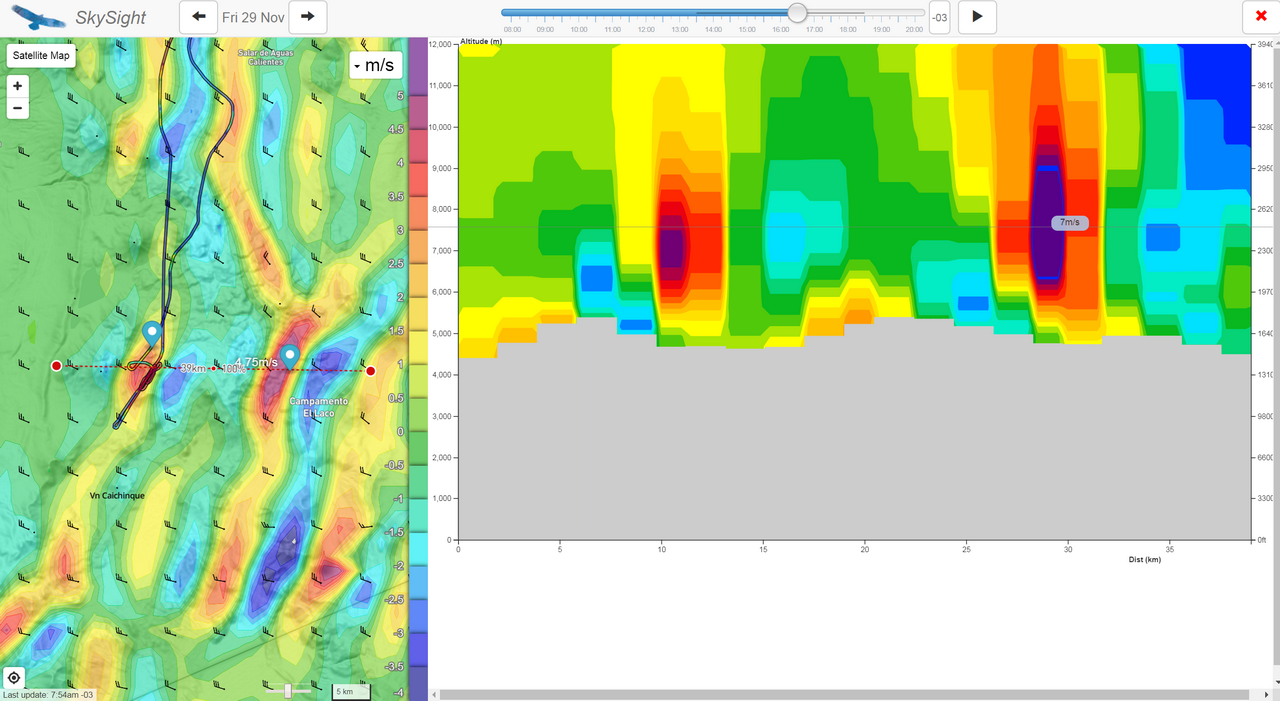
A very useful function of SkySight is the possibility to generate wave cross sections. In the example below, November 29th flight, we can:
- Measure the distances between the rebounds, in this case 18 km;
- Observe the minimum altitude to were the rebounds becomes usable. In this case 5,500-6,000 m for the first one and 5,000-5,500 m for the second one;
- Evaluate the strength of the lift and its limits, in this case 5-6 m/s for the first rebound and up to 8,000 m, then 7 m/s for the second rebound which worked up to 10,000 m. But to exploit these rebounds, we need another oxygen delivery system (pressurized).
- And this every 30 minutes until night.
